Examples#
Featured Tutorials#
PyOD has been well acknowledged by the machine learning community with a few featured posts and tutorials.
Analytics Vidhya: An Awesome Tutorial to Learn Outlier Detection in Python using PyOD Library
KDnuggets: Intuitive Visualization of Outlier Detection Methods
Towards Data Science: Anomaly Detection for Dummies
Computer Vision News (March 2019): Python Open Source Toolbox for Outlier Detection
awesome-machine-learning: General-Purpose Machine Learning
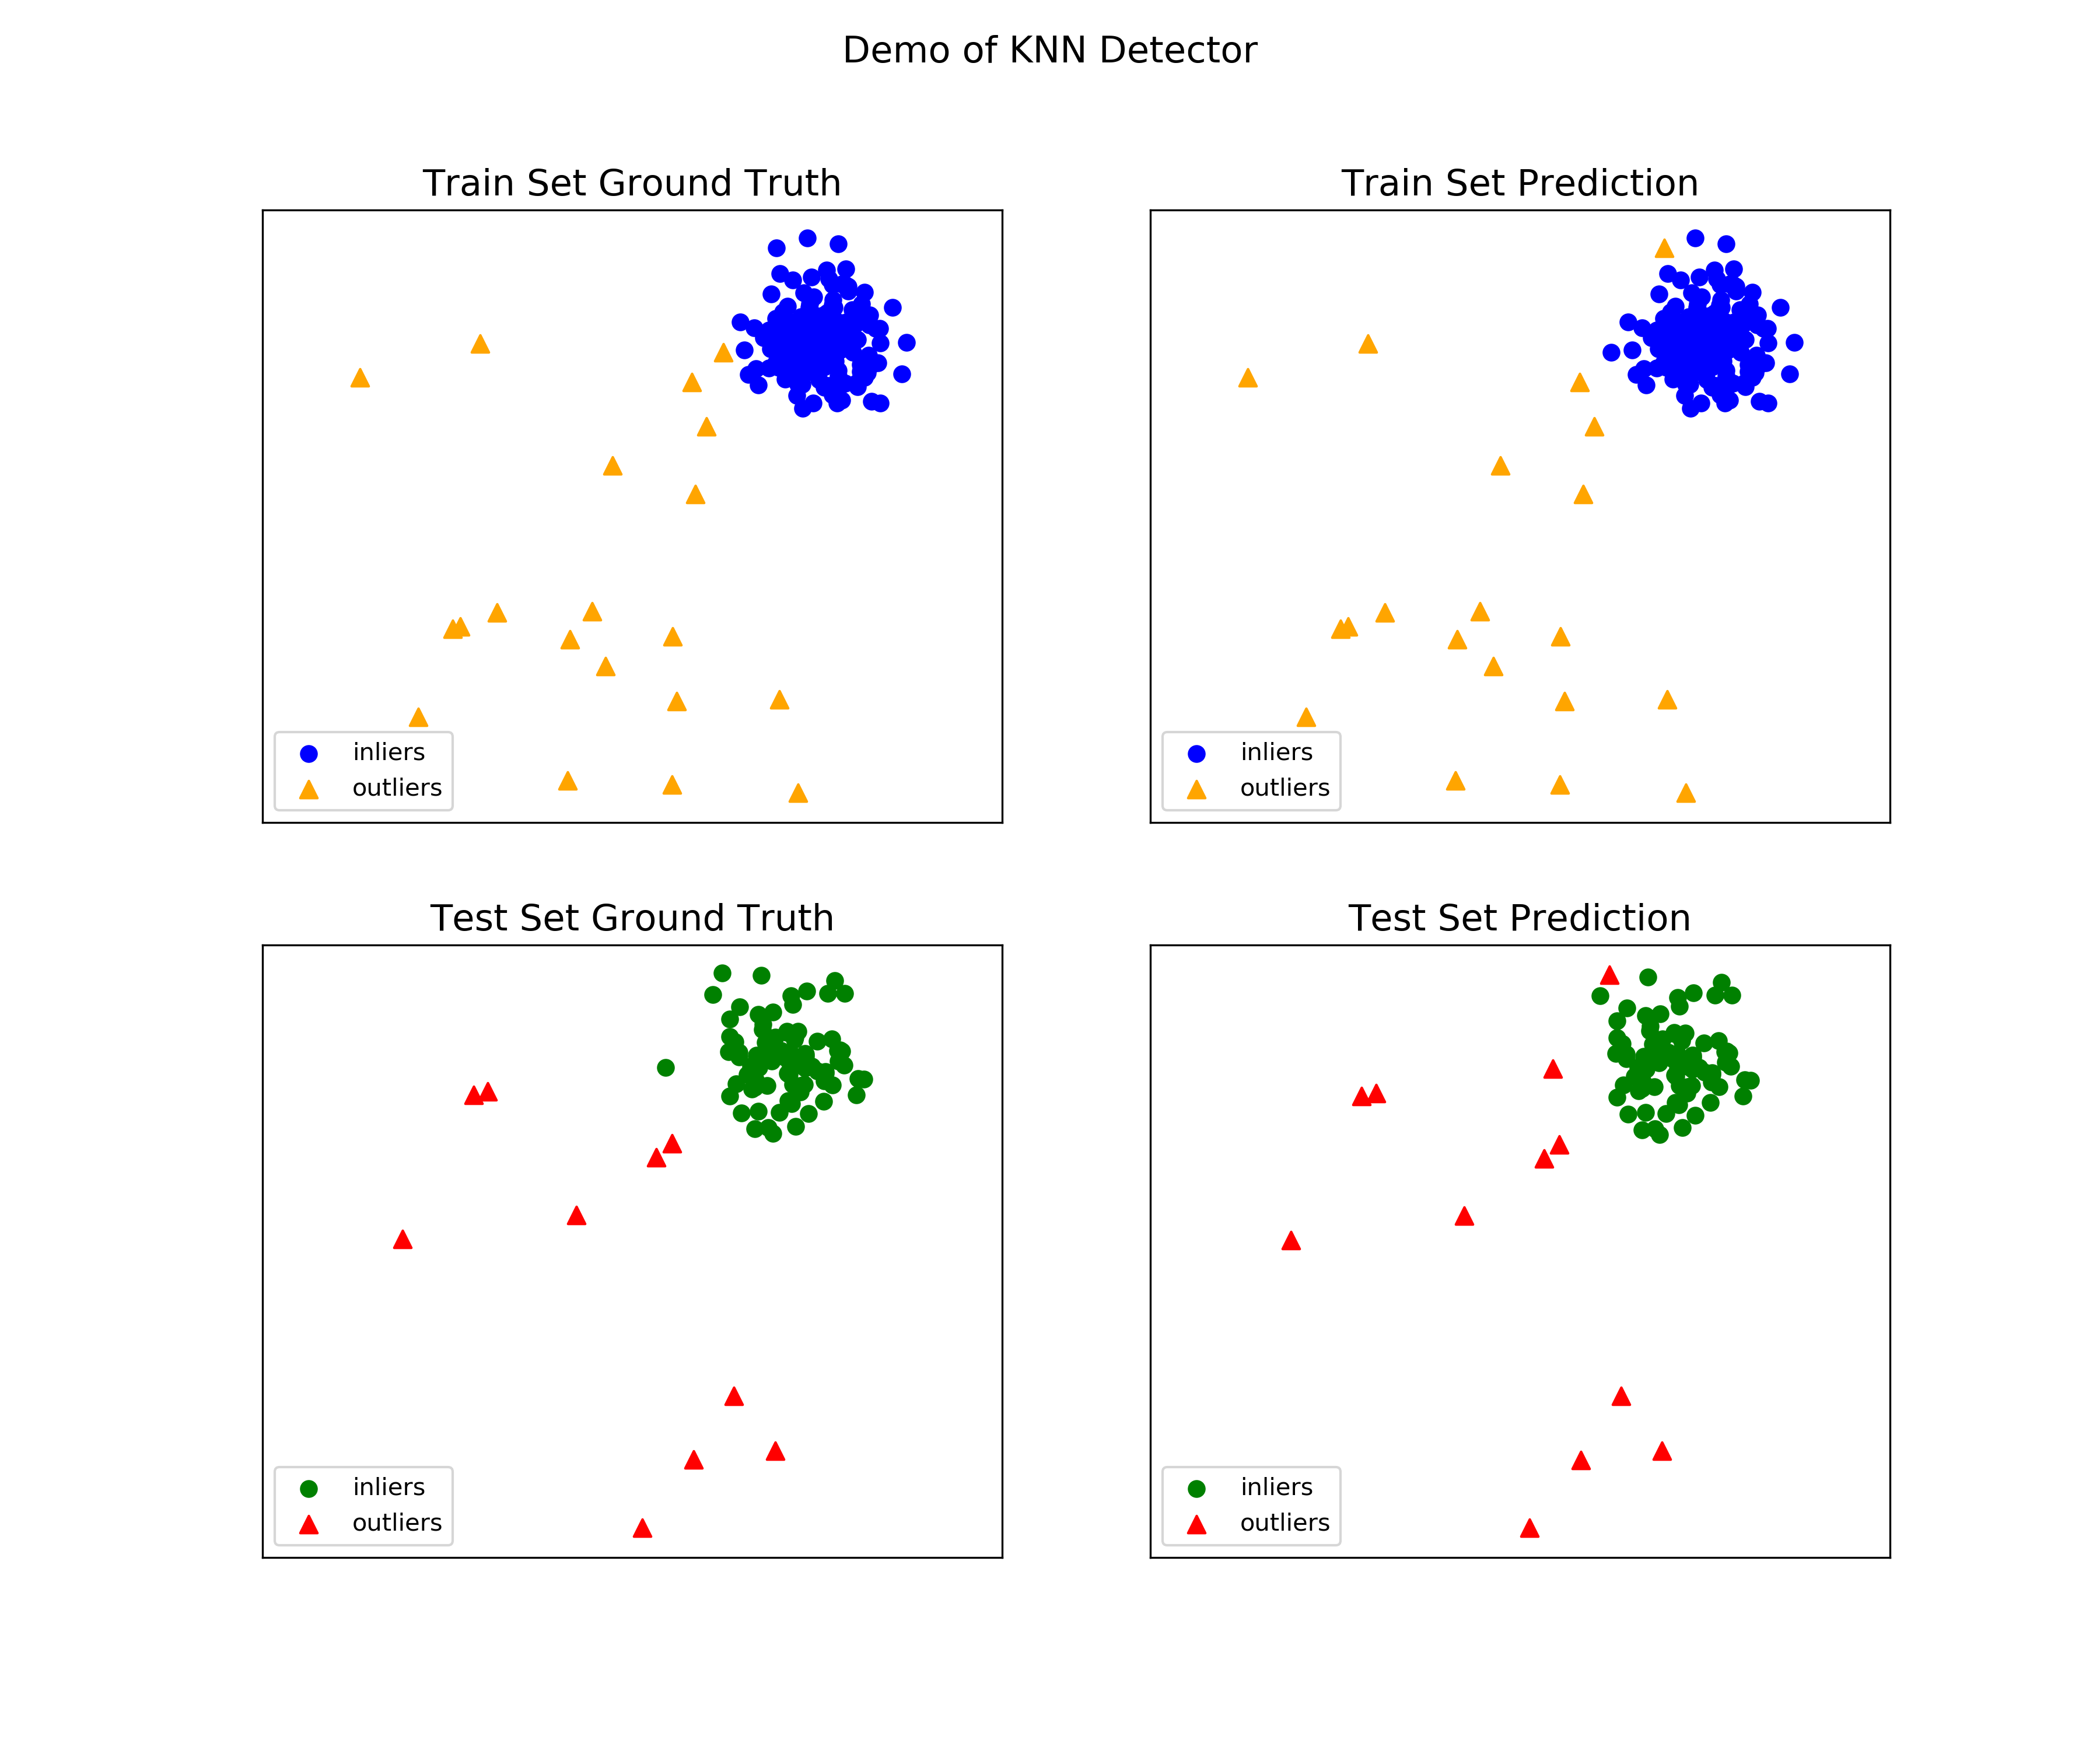
kNN Example#
Full example: knn_example.py
Import models
from pyod.models.knn import KNN # kNN detector
Generate sample data with
pyod.utils.data.generate_data():contamination = 0.1 # percentage of outliers n_train = 200 # number of training points n_test = 100 # number of testing points X_train, X_test, y_train, y_test = generate_data( n_train=n_train, n_test=n_test, contamination=contamination)
Initialize a
pyod.models.knn.KNNdetector, fit the model, and make the prediction.# train kNN detector clf_name = 'KNN' clf = KNN() clf.fit(X_train) # get the prediction labels and outlier scores of the training data y_train_pred = clf.labels_ # binary labels (0: inliers, 1: outliers) y_train_scores = clf.decision_scores_ # raw outlier scores # get the prediction on the test data y_test_pred = clf.predict(X_test) # outlier labels (0 or 1) y_test_scores = clf.decision_function(X_test) # outlier scores # it is possible to get the prediction confidence as well y_test_pred, y_test_pred_confidence = clf.predict(X_test, return_confidence=True) # outlier labels (0 or 1) and confidence in the range of [0,1]
Evaluate the prediction using ROC and Precision @ Rank n
pyod.utils.data.evaluate_print().from pyod.utils.data import evaluate_print # evaluate and print the results print("\nOn Training Data:") evaluate_print(clf_name, y_train, y_train_scores) print("\nOn Test Data:") evaluate_print(clf_name, y_test, y_test_scores)
See sample outputs on both training and test data.
On Training Data:
KNN ROC:1.0, precision @ rank n:1.0

On Test Data:
KNN ROC:0.9989, precision @ rank n:0.9
Generate the visualizations by visualize function included in all examples.
visualize(clf_name, X_train, y_train, X_test, y_test, y_train_pred,
          y_test_pred, show_figure=True, save_figure=False)
Model Combination Example#
Outlier detection often suffers from model instability due to its unsupervised nature. Thus, it is recommended to combine various detector outputs, e.g., by averaging, to improve its robustness. Detector combination is a subfield of outlier ensembles; refer [BKalayciE18] for more information.
Four score combination mechanisms are shown in this demo:
Average: average scores of all detectors.
maximization: maximum score across all detectors.
Average of Maximum (AOM): divide base detectors into subgroups and take the maximum score for each subgroup. The final score is the average of all subgroup scores.
Maximum of Average (MOA): divide base detectors into subgroups and take the average score for each subgroup. The final score is the maximum of all subgroup scores.
“examples/comb_example.py” illustrates the API for combining the output of multiple base detectors (comb_example.py, Jupyter Notebooks). For Jupyter Notebooks, please navigate to “/notebooks/Model Combination.ipynb”
Import models and generate sample data.
from pyod.models.knn import KNN  # kNN detector
from pyod.models.combination import aom, moa, average, maximization
from pyod.utils.data import generate_data

X, y= generate_data(train_only=True)  # load data
Initialize 20 kNN outlier detectors with different k (10 to 200), and get the outlier scores.
# initialize 20 base detectors for combination
k_list = [10, 20, 30, 40, 50, 60, 70, 80, 90, 100, 110, 120, 130, 140,
            150, 160, 170, 180, 190, 200]
n_clf = len(k_list) # Number of classifiers being trained

train_scores = np.zeros([X_train.shape[0], n_clf])
test_scores = np.zeros([X_test.shape[0], n_clf])

for i in range(n_clf):
    k = k_list[i]

    clf = KNN(n_neighbors=k, method='largest')
    clf.fit(X_train_norm)

    train_scores[:, i] = clf.decision_scores_
    test_scores[:, i] = clf.decision_function(X_test_norm)
Then the output scores are standardized into zero average and unit std before combination. This step is crucial to adjust the detector outputs to the same scale.
from pyod.utils.utility import standardizer

# scores have to be normalized before combination
train_scores_norm, test_scores_norm = standardizer(train_scores, test_scores)
Four different combination algorithms are applied as described above:
comb_by_average = average(test_scores_norm)
comb_by_maximization = maximization(test_scores_norm)
comb_by_aom = aom(test_scores_norm, 5) # 5 groups
comb_by_moa = moa(test_scores_norm, 5) # 5 groups
Finally, all four combination methods are evaluated by ROC and Precision @ Rank n:
Combining 20 kNN detectors
Combination by Average ROC:0.9194, precision @ rank n:0.4531
Combination by Maximization ROC:0.9198, precision @ rank n:0.4688
Combination by AOM ROC:0.9257, precision @ rank n:0.4844
Combination by MOA ROC:0.9263, precision @ rank n:0.4688
Thresholding Example#
Full example: threshold_example.py
Import models
from pyod.models.knn import KNN   # kNN detector
from pyod.models.thresholds import FILTER  # Filter thresholder
Generate sample data with
pyod.utils.data.generate_data():contamination = 0.1 # percentage of outliers n_train = 200 # number of training points n_test = 100 # number of testing points X_train, X_test, y_train, y_test = generate_data( n_train=n_train, n_test=n_test, contamination=contamination)
Initialize a
pyod.models.knn.KNNdetector, fit the model, and make the prediction.# train kNN detector and apply FILTER thresholding clf_name = 'KNN' clf = KNN(contamination=FILTER()) clf.fit(X_train) # get the prediction labels and outlier scores of the training data y_train_pred = clf.labels_ # binary labels (0: inliers, 1: outliers) y_train_scores = clf.decision_scores_ # raw outlier scores
References
İlker Kalaycı and Tuncay Ercan. Anomaly detection in wireless sensor networks data by using histogram based outlier score method. In 2018 2nd International Symposium on Multidisciplinary Studies and Innovative Technologies (ISMSIT), 1–6. IEEE, 2018.